Electric Vans have doubled their share of the new van market since June last year

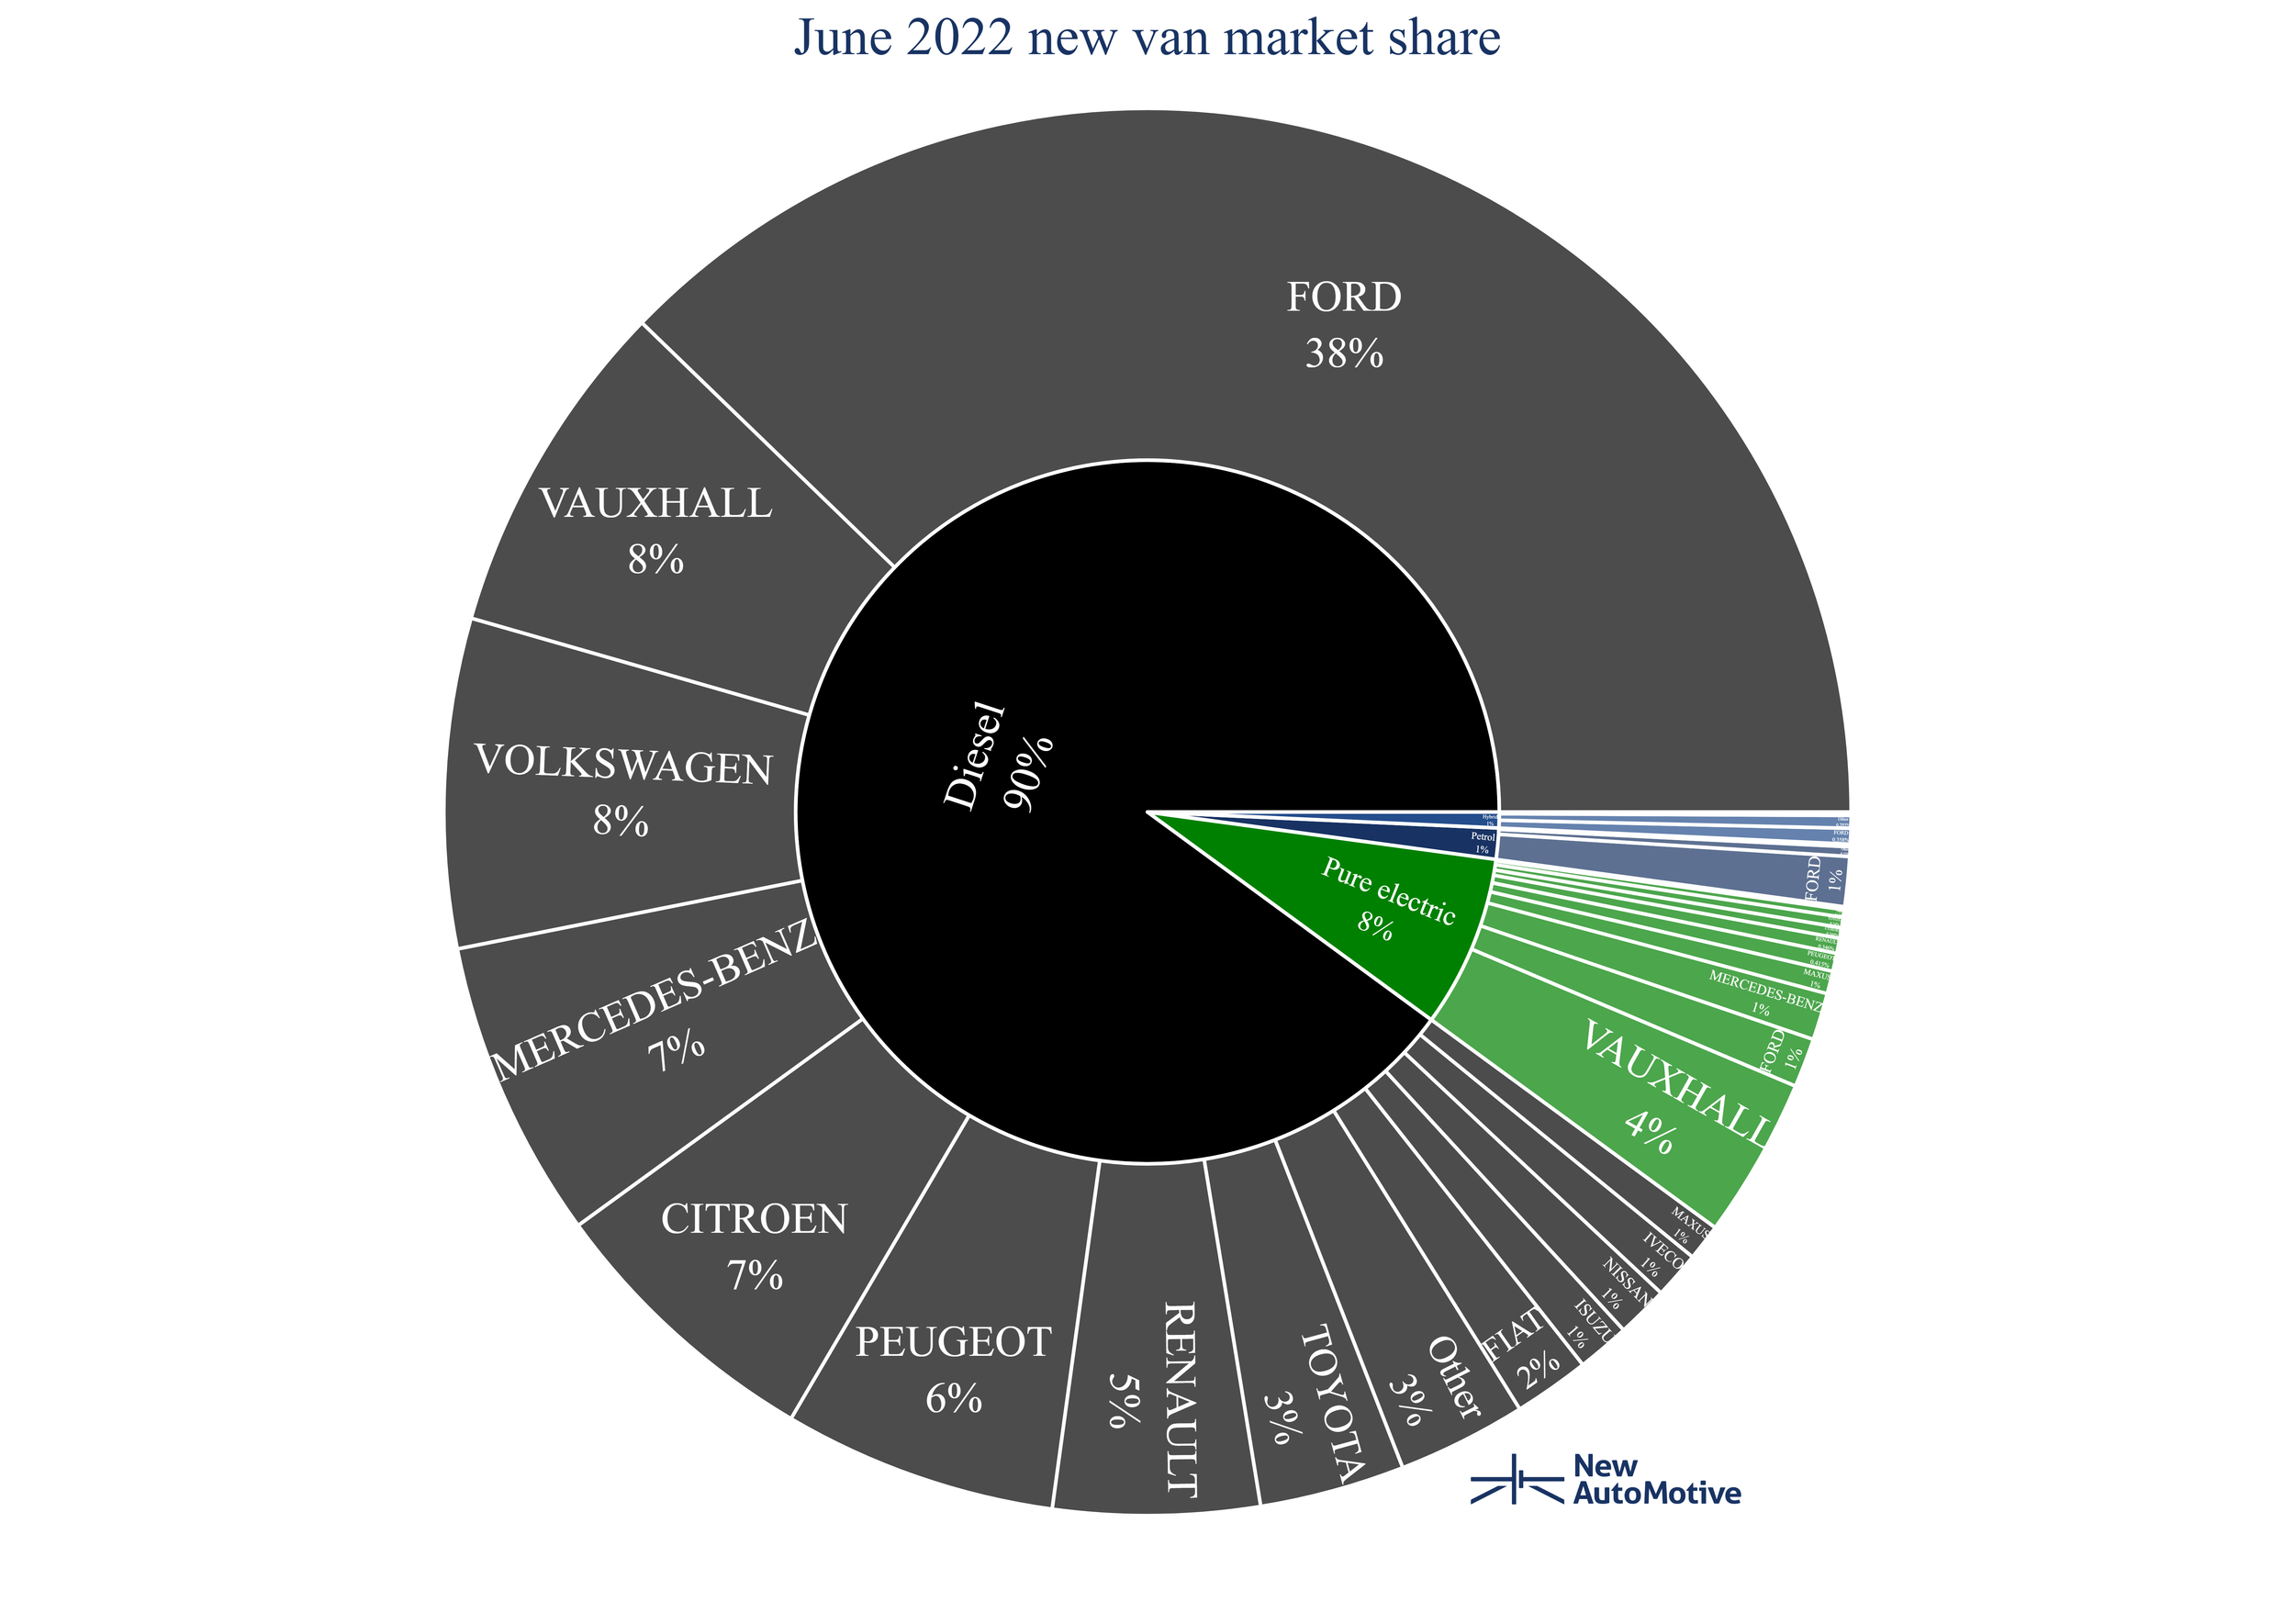
Electric Vans have doubled their share of the new van market since June last year, with 8% of all new vans sold in June month being electric, cutting into diesel’s dominance. The government’s planned ZEV Mandate has proposed setting a zero emission sales target of 8% in 2024. As the market is already hitting this target the government should prioritise creating highly ambitious targets that will push the market forward, rather than hold it back.
⚡ What Our Data Shows
Ciara Cook, Research and Policy Officer at New AutoMotive, said:
“The only way we can move the needle on electric vans is to be conscientious in how we monitor the transition. Data is so crucial as it shows an unbiased view of how the industry is moving and where it needs further support.
“As it stands, more than nine in ten vans sold are diesel - the electric van market is still in early stages. The opportunity is now for this market to capitalise on the electric car momentum, and based on our data the same trajectory is possible with electric vans.
“The upcoming ZEV Mandate is an opportunity for the government to drive the electric van market forward. The policy itself needs to be ambitious and incentivise manufacturers to exceed industry targets - it’s a critical time and we can’t be complacent.
“Just as we’ve seen with the success of our Electric Car Count, we’re excited to launch the Electric Van Count to bring the same momentum change and accountability to the van market in its transition.”
The full data release is available here. You can view the data on our interactive dashboard, here.

📈 UK market overview
Electric van sales are currently down 24% from June 2021 showing a similar story to passenger vehicle sales where numbers have been affected by the cost of living crisis and global supply chain problems. However, electric vans are the only segment of the market that has seen a significant increase in actual sales compared to 12 months ago and a doubling of their % share.

📌 Regional highlights
We track regional registrations using a three-month rolling average, which masks big variations in EV market share from month to month. The DVLA regions with the highest share of EVs are as follows:
Oxfordshire - 37%
East Anglia - 23%
North East England - 18%
London - 18%
Severn Valley - 16%
Refer to tables 4 & 5 for full regional statistics.
🚗 The race for EV market share
Vauxhall delivered a staggering 47% of all new electric vans this month showing its dominance in this market. However, Ford has come from a standing start, selling zero electric vans this time last year, to accounting for 14.3% of the market this month. Ford is a dominant player in the UK van market so this still only accounts for 3% of its total sales showing it still has a long way to go.

For the full data, and year-on-year comparisons, refer to table 1 in the full release.
📊 The brands who are quickest to electrify
A surprise entry at the top shows Maxus with a total of 38% of their vans sold being electric. However, the brand only accounts for 1% of overall van sales this month. Of the high volume brands Vauxhall leads with 32% of all vans sold this month being electric proving Vauxhall is a dominant figure in the electric van market.

We exclude brands that are 100% electric from this table since they do not need to electrify their sales. For the full data, refer to table 2 in the full release.
Notes
About Electric Van Count
Electric Van Count is a monthly data series from New AutoMotive, a not-for-profit independent transport research organisation with a mission to accelerate and support the UK’s transition to electric vehicles. You can find out more about New AutoMotive by visiting www.newautomotive.org/mission
Electric Van Count provides an overview of the newly licensed vans. It is released monthly, on the second Monday of each month, providing data on the previous month’s newly licensed vans. In the UK, vehicles must be licensed (also known as registered) to be legally driven on UK roads.
We provide an overview of the state of the market, showing the number of cars registered by each manufacturer, broken down by fuel type. This provides a new way to track the transition to Electric vans in the UK.
Visit our interactive data dashboard here: https://newautomotive.org/evc
For more background information on the statistics we provide, you can read our blog about the race for EV market share: www.newautomotive.org/blog/the-race-for-ev-market-share-is-under-way
Data sources & methodology
The data shows the number of type N1 vehicles (vehicles for the carriage of goods with a maximum mass not exceeding 3.5 tonnes) in the DVLA’s vehicle licensing database as it stands on, or shortly after, the 1st day of the month. The DVLA’s vehicle licensing database is the legal record of all vehicles licensed for use in the UK. We obtain the data from the DVLA’s vehicle enquiry service API, and the DVSA’s MOT history API.
The data covers all vans with a standard form UK vehicle registration mark (VRM, i.e. the vehicle’s number plate), but does not capture any vehicles with personalised VRMs.
Terminology
We use the following terms to refer to vehicle fuel types:
Pure electric: battery electric, or other purely electric-powered vehicles (such as hydrogen). These are vehicles where the drivetrain of the vehicle is only electric, with no facility to drive using a fossil fuelled engine.
Hybrid: vehicles that have the ability to drive under electric power or under fossil fuel power. These include vehicles classified by the DVLA as “hybrid electric”, “electric diesel”, for example.
Q&A
Why are the numbers different from other organisations, such as the SMMT?
Our numbers are typically slightly different from those published by the SMMT. We cannot speculate as to why this is because the SMMT do not publish the methodology for obtaining their vehicle data.
Our data is based on the DVLA’s legal record of vehicles licensed as it stands on the first of the month.
Our methodology does not capture newly registered vehicles with a personalised number plate. These take longer to appear in our database, and are not included in the monthly release. We do not believe that these are a statistically significant part of the market.
Will you make this data open and accessible to more organisations?
Yes, we are happy to supply the data to anyone where doing so will not conflict with our mission. We encourage people to reach out to us on data@newautomotive.org.